
Our on-going public opinion polling of beach goers in the wake of the Refugio Oil Spill is beginning to show some interesting patterns. We are still in the midst of collecting data (check back in a week or two when we have had a chance to fully explore this data coming in daily), but a few trends are beginning to come into focus.
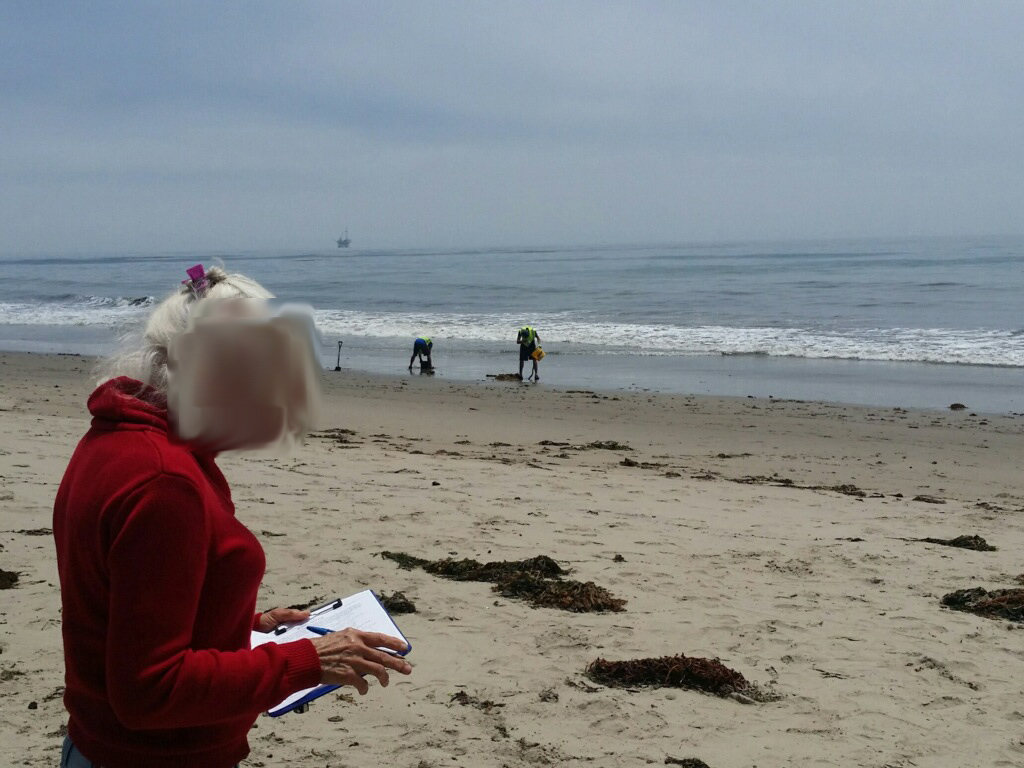
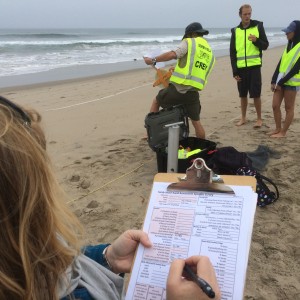
Anonymous beach goer taking our brief opinion survey in the make of the Refugio Oil Spill at Haskell’s Beach in Santa Barbara a few days after the pipeline break.
For example, there appears to be a difference in the public’s perception of the safety of seafood from the Santa Barbara area in the wake of the Refugio Spill. As we have seen with the Deepwater Horizon in the Gulf of Mexico, the Fukushima disaster in Japan, and several other recent coastal catastrophes, the public is quick to take a dim view of the safety of food from impacted areas. We have already seen a change in the perception of the safety of seafood from Santa Barbara relative to other regions of California (see figure below).
Our surveys ask if people feel seafood from various regions of the globe is safe to eat. Below you will see our interim results as of this past Wednesday. In the wake of this spill there is an apparent hesitancy amongst a subset of the public with to consume seafood from spill-affected and (as always happens in such situations) spill-adjacent regions. This whole matter is complicated by the fact most people don’t ask about where their seafood comes from on a day-to-day basis. We’ll put a pin in that key point and discuss that in a future post on seafood.

Other changes in levels of public sentiment are becoming evident. This is perhaps best exemplified by changed support/opposition for offshore drilling along California’s coast. As you may well expect, we have been finding decreased support in recent weeks for offshore oil and gas drilling in California waters relative to our “normal” opinions we document each fall (we conduct 1,000 to 1,500 in-person surveys each year from mid September to mid October). The graph below contrasts our most recent fall data (2014) to data we have been collecting over the last few weeks.

Lastly, we are also beginning to see possible geographic patterns underlying perceptions and behaviors. People’s actions might be correlating with the amount of tar a region received over the past few weeks. An example of this may be our willingness to spend money based on where we are and how long we might stay around. As of yet this is only hinted at in the initial responses we are seeing (i.e. it is not yet statically significant). But as we increase our sample size, we may see these geographic differences become robust and statistically significant. Unlike seafood, I would expect this effect to be comparatively fleeting. Assuming this is a truly significant trend we are documenting, my best guess is that any such difference would have disappeared by the end of the summer tourist season (barring some unforeseen new development that would keep the spill in the public’s eye).
The following figure hints that the more tarring a site accumulates, the lower the financial input to that beach and adjacent areas from beach-going visitors. Presumably this is being driven by the fact that people are less likely to stay around. I should note that these sites are not necessarily clumped within one or two spots adjacent to Refugio; the recent pitter patter pattern of tarring across our region has afforded us a much more robust opportunity to study this exact questions without the typical spatial autocorrelation (note: autocorrelation is fancy statical talk for the problem that arises when chance and happenstance corrupt our nice, objective exploration of the natural world and render powerless our normal tools to detect differences). Our polling data has been collected across more than 33 beaches/sampling points spanning four counties in coastal southern California.

My students, colleagues, and I are very keen to explore further the interactions across these coupled human-natural systems. Many hypotheses and patterns are available for us to test thanks to our wealth of long-term, annual surveys and dozens of recent beach ecological assessments we have conducted over the previous weeks and years. If only we didn’t need to sleep, we would have these analyses done by now!
Stay tuned.
Leave a Reply