
It is hard to underestimate the influence our Federal Energy Information Agency (EIA) has on energy markets. Their annual and quarterly reports, littered with predictions, drive investments, public policy, and global understanding of energy production and consumption.
So the recent coming to terms with the fact that the EIA has of late been hugely overestimating American petroleum consumption is cause to sit up and take notice. A very readable overview of this overestimate was pulled together this past summer by Lydia Cox for the World Economic Forum:
US oil production has transformed itself fundamentally in the past decade. Between 1970 and 2008, US crude oil production fell by nearly half as conventional wells were depleted. Since 2008, however, production has rebounded from 5 million barrels per day to an average of 8.7 million barrels per day in 2014. The almost entirely unexpected increase – largely attributable to technological innovations such as advances in horizontal drilling, hydraulic fracturing, and seismic imaging – has helped the US become the world leader in oil production.
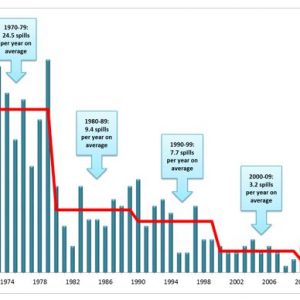
Whereas the developments in oil production have been widely reported and appreciated, far less attention has been paid to US petroleum consumption’s remarkable decline relative to both recent levels and past projections — one of the biggest surprises to have occurred in global oil markets in recent years. Petroleum consumption in the US was lower in 2014 than it was in 1997, despite the fact that the economy grew almost 50% over this period. As illustrated in Figure 1, consumption rose steadily from 1984 through the early 2000s, peaking in 2004 before decreasing in conjunction with rising oil prices.

US petroleum consumption between 1949 and 2014 (in millions of barrels of crude oil per day). Figure: Energy Information Administration (as cited in Cox 2015).
The deviation from the EIA’s estimation from more than a decade ago for our American consumption is sizable:

Deviation between historic (2003) and current (2015) EIA predictions of U.S. petroleum consumption to 2025. Figure: Energy Information Administration (cited in Cox 2015).
Unfortunately this massive deviation from the expected growth in oil consumption is a uniquely American phenomenon and primarily a transportation sector phenomenon. Simply put, we are burning less gas a diesel in our cars and trucks due to two main factors:
- reduced miles driven on average (formally referred to as Vehicle Miles Traveled, VMT)
- improved fuel efficiency

Reduced oil consumption owes almost entirely to improved fuel consumption rate and reduced vehicle miles traveled in the transportation sector. Figure: Energy Information Administration (cited in Cox 2015).
To date the reduced miles driven accounted for the majority of fuel savings, As Cox explained:
Between 2003 and 2014, gasoline prices explain a large share of the fuel economy increase of the light-duty fleet. However, over time we expect fuel economy standards to have a growing influence on fuel economy — both for the light- and heavy-duty fleets. Fuel consumption from the heavy-duty fleet accounts for one-fifth of total transportation sector consumption, and is the fastest growing component in the transportation sector. New heavy-duty fuel economy standards that the Administration has announced will reduce actual transportation sector consumption relative to even the 2015 projections, which do not reflect these new standards.
Given the importance of miles travelled in explaining the surprises, we use household survey data to present new evidence on the factors underlying the changes. Demographics appear to explain a very large portion of the vehicle miles travelled developments, but we also find evidence that the effects of demographics and economic variables on vehicle miles travelled have changed over the past 20 years. Such changes present a major challenge to projecting future petroleum consumption.
On into the future, improved fuel efficiency via improving Corporate Average Fuel Efficiency (CAFE) standards will become to greater driver of lowered consumption:
In 2014, rising fuel economy explains roughly 25% of the consumption surprise, and vehicle miles travelled explain the remaining three quarters. In the 2025 projections, however, the factors are more comparable, with fuel economy accounting for 45% of the surprise and vehicle miles travelled accounting for 55%, demonstrating the growing rule of public policies like fuel economy standards in shaping fuel use.
In sum, the high gas prices we have been seeing over the past decade have helped curb our driving habits and ultimately lead to our burning less fuel. Over the coming decade, our current Clean Energy Strategy Policy will likely be at the root of this reduce oil consumption. In and of itself it is not strong enough to get us to a sustainable future. But this dramatic reduction in estimated oil consumption shows effective policy and clear drivers can indeed push our US economy into a low carbon future. This can work.
References
Cox, Lydia. 2015. The surprising decline in US petroleum consumption. World Economic Forum Blog. Posted July 10, 2015. Accessed February 21, 2015.


Leave a Reply